
I built the Poor Man's Uptime Checker module as a way for me to be able to check the uptime of external services using my existing Drupal site. This saves me some money because I don't need to pay for an external subscription with a service such as Pingdom. Their base plan starts at $10/month, which is almost double the cost of the server hosting this site! That's with a cap of just 10 checks too.
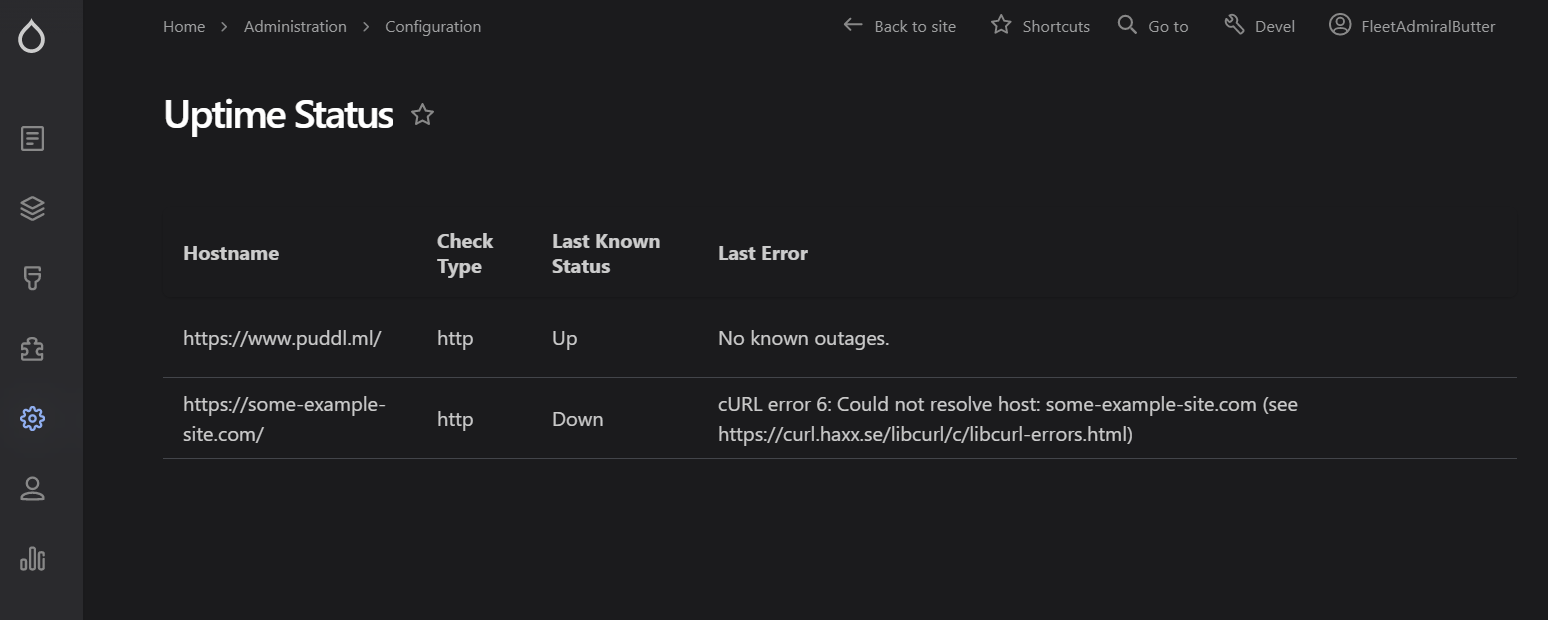
The PMUC module defines its own drush command, pmuc-check-all, which performs an HTTP GET request against all hosts specified in its config. My server's crontab is configured to call this Drush command once a minute to run uptime checks. If a request fails, the module logs the error on its status page and informs the user via email that an outage was detected. The information on the status page can then be used to determine the cause of the outage.
The module is still under development and definitely shouldn't be used on a production site yet, but I do have it running here and it has been quietly doing its job so far. I'll continue to monitor the amount of bandwidth it chews up but my server host provides 1TB of bandwidth per month, and I doubt plaintext requests will be able to consume any significant proportion of that.
Update:
After about a month of testing, I've got some statistics on network usage.
My installation of the PMUC module has 8 websites that it is pinging every minute.
This has results in network data consumption of about 2GB/day:
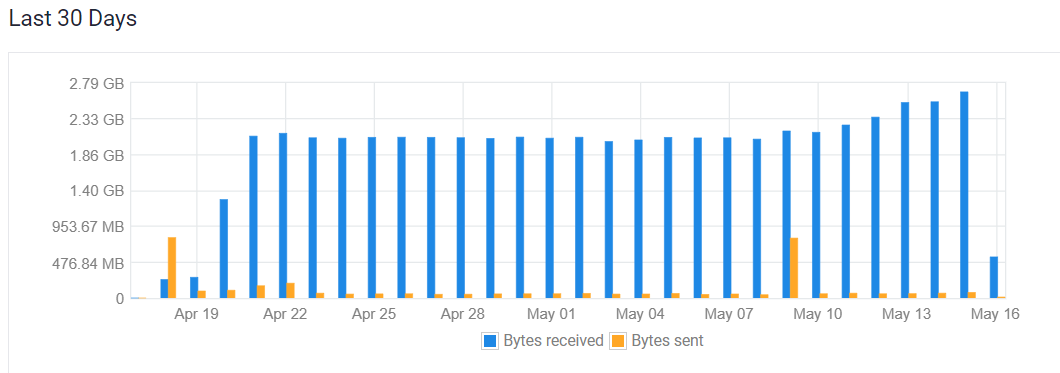
All in all, this works out to about 60GB per month of traffic. However, if I were looking to reduce this, I could simply reduce the frequency of the checks in the crontab. But for now, I am comfortably within my 1TB limit.